ELEN4012A · FINAL-YEAR CAPSTONE

A simple message.
A frustrating
interruption.

A routine update is only useful if it reaches the person waiting for it. LightLink explores whether suitable existing power wiring and a local light receiver could carry non-critical messages with fewer interruptions.

POWER LINE COMMUNICATION × VISIBLE LIGHT COMMUNICATION

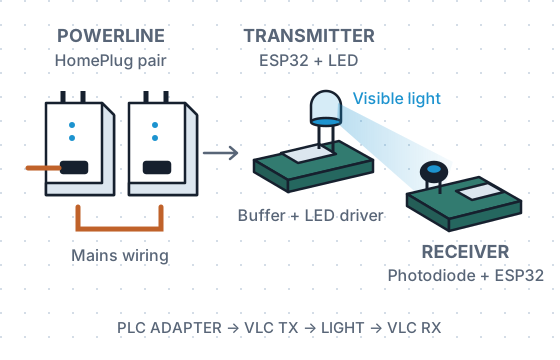
THE SIGNAL JOURNEYProject illustration
A power line feeds a gateway buffer, then an LED sends light to a photodiode receiver.
Carried by copperDelivered by light
01 / THE PROJECT

Existing wires. A small buffer. A different last hop.

THE PROBLEM & OUR APPROACH

Why the message
needs a reserve.

Imagine a maintenance team at a fixed receiving point waiting for an update that stops halfway through. Reusing suitable wiring could reduce the need for another cable route, but uneven delivery still has to be managed. This is a proposed use, not a mine-tested service.

THE PURPOSE

Help the message reach its user.

For routine maintenance or status messages, a complete update matters more than a link that is fast only some of the time. The proposed route reuses suitable electrical wiring and ends at a dedicated light receiver. Extra equipment is still needed; mine coverage and cost savings have not been demonstrated.

THE CHALLENGE

The two links don’t keep the same pace.

Across 31 laboratory arrival records, PLC gaps reached about 5.46 seconds. A high mean delivery rate did not remove those pauses. Meanwhile, the optical link drains its queue at a limited rate, so both running empty and admitting too much data matter.

OUR SOLUTION

Store briefly. Send steadily.

A 105,472-byte FIFO stores the reserve. The selected mode starts at the declared 75% fill level and uses occupancy feedback to target 85%. In the integrated comparison it maintained headroom without recorded full-FIFO rejections. A finite reserve still cannot cover every measured interruption.

Try the handoff

Step-by-step illustration

Compare a six-packet burst with and without storage. Each step represents a VLC opportunity to send up to two packets; these are teaching units, not measured hardware rates.

Gateway mode
PLC INPUTReadyBursts or pauses
Gateway buffer0 / 8 packets
Eight illustrative storage slots
VLC OUTPUT0 sentUp to 2 per step

Send a burst to see the gateway hold data while the light link sends at its own pace.

0 packets lost

A buffer buys time; it does not increase VLC capacity, remove electrical interference, or cover an indefinite outage. Once storage fills, excess input is lost in this model. In the real system, backpressure or retries must be handled by the transport and gateway.

Explore buffer size and interference ↓

FROM WALL TO LIGHT

How a message finds its way.

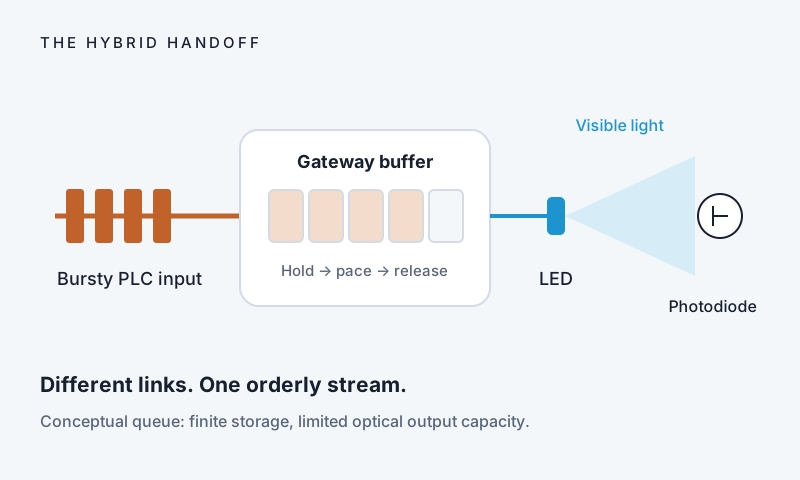
PLC brings the data in. A buffer helps manage the handoff. VLC carries it across the optical link.

Mains wiring (PLC)Buffersmooths burstsLight link (VLC)RX
01

Over the power line

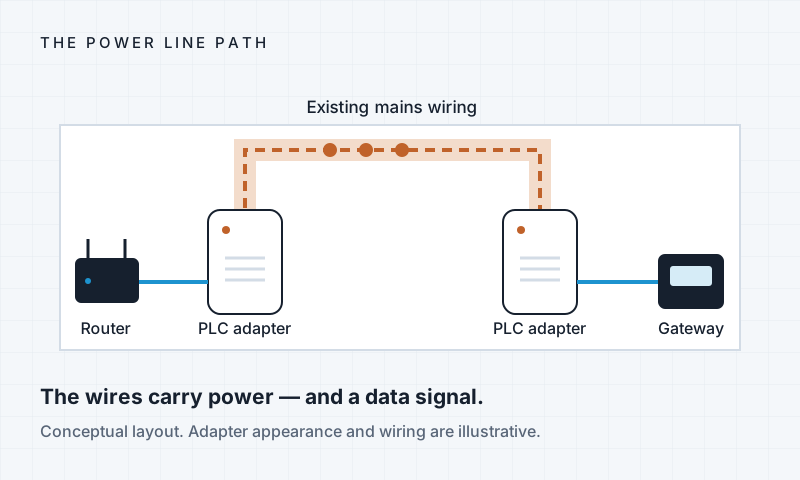
PLC adapters use the mains wiring as a communication path. Interference can make delivery uneven.

02

Through a buffer

Queued messages wait at the gateway until the optical transmitter is ready to carry them.

03

Out through light

An LED carries the encoded message. A photodiode and receiver electronics turn it back into data.

02 / THE BUFFER CHALLENGE

Keep the picture.
Lose the waiting.

Protect the image without leaving too much data waiting. Three challenges. One shared scoreboard.

60-second buffer challenge

Illustrative model

Your nickname and scores appear online after three attempts. Use a nickname rather than contact details.

Practice first, or enter a nickname to play the same calm, busy and harsh challenges as everyone else.

    Results are shown in the statistics below.
    PLC outageBuffer fillCapacityOverflow
    –Overflow loss
    –Peak fill
    –FIFO queue delay bound
    –Longest PLC outage

    How your score works

    Each attempt starts at 1,000 points. Subtract 20 points per percentage point of data unavailable at 60 seconds, and 100 points per second of peak FIFO queue delay. Scores stop at zero. Your ranked score is the rounded average of all three attempts. Your best complete round per nickname is ranked; earlier-started completed rounds break ties.

    Everyone uses the same deterministic traces. The server recalculates results from your buffer choices. Overflow and data still waiting at the deadline count toward missing image tiles. Queue delay is estimated from peak queued data ÷ optical drain rate; a larger empty buffer does not inherently slow the link.

    60 model seconds play in about 10 seconds on screen. Teaching rates: source 10 kB/s, PLC bursts 40 kB/s, optical drain 12.5 kB/s. These are not measured project rates. The game never controls the rig.

    Shared online scoreboard

    Loading the shared scoreboard…

    Average of three server-calculated attempts
    RankNicknameAverageCalmBusyHarsh

    PLC INVESTIGATION / REPORT UPDATED 26 OCTOBER 2026

    A fast link can still
    leave the user waiting.

    Broken delivery can interrupt a routine message even when average PLC speed is high. The investigation starts with those gaps, then asks how much data to hold in reserve and how to keep that reserve usable.

    HOW WE INVESTIGATED THE PROBLEM

    Measure first. Size the reserve. Compare the controls.

    Packet captures record when PLC data arrive. Their gaps inform the buffer requirement. A separate integrated comparison then tests five startup and sender-pacing modes with a charger connected, observing useful output and buffer fill.

    PLC SURVEY31 records

    5,393 seconds of packet arrivals across two laboratories.

    LONGEST RECORDED GAP~5.46 s

    The 2.5 s sizing target does not cover every interruption.

    IMPLEMENTED FIFO105,472 bytes

    103 KiB, with declared 75% startup and 85% occupancy target.

    SELECTED TESTED CONFIGURATION

    Gated startup.
    Occupancy feedback.

    The source adjusts admission to preserve a reserve and leave room for arrivals. It does not change FIFO capacity or the optical clock.

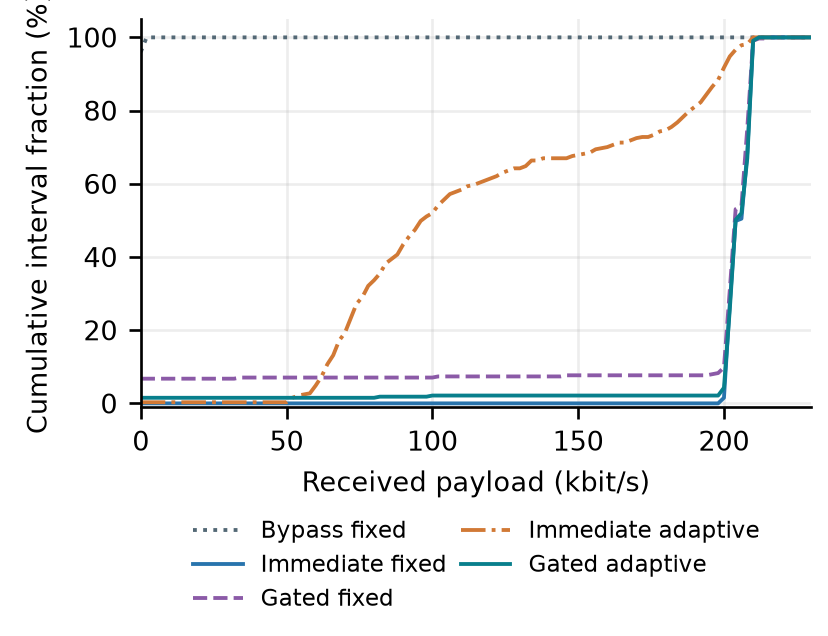
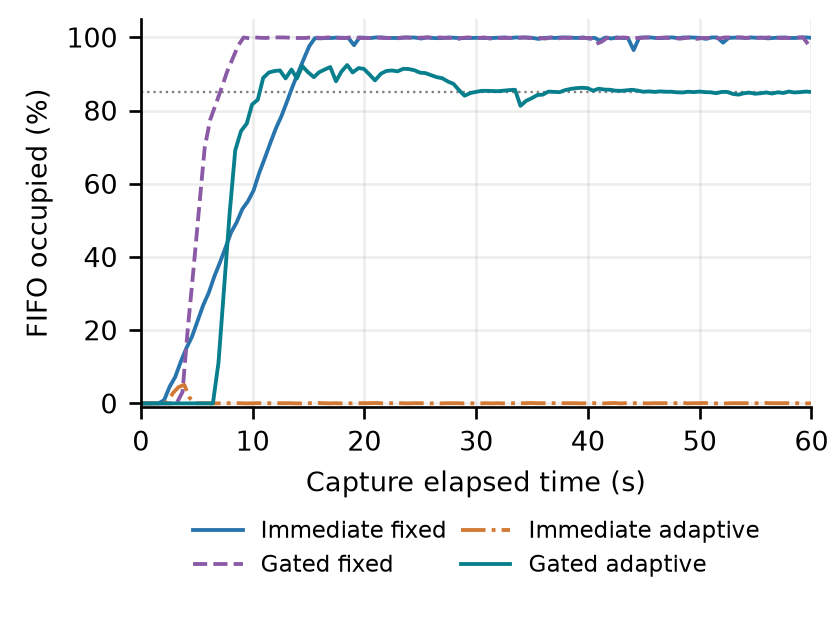
    The selected mode delivered 201.24 kbit/s of received payload after the first 5 seconds and held 84.96% mean fill, with no recorded full-FIFO rejections across its three complete captures.

    Immediate fixed-rate buffering delivered slightly more payload, but saturated the queue. The selection favours inventory and admission headroom, rather than the highest output alone.

    What was compared?

    Five modes, with three 60-second repeats each. A 65 W laptop charger was connected, the iron was off, the optical path was 3 cm at 0-degree alignment, and the nominal optical setting was 280 kbit/s.

    The PLC characterisation used a TL-PA7017 pair. Integrated tests used TL-PA4010 and TL-WPA4220 adapters. Their advertised link rates are not application payload rates.

    Three different quantities: 300 kbit/s is the conservative sizing basis and tested optical maximum; 280 kbit/s is the integrated nominal setting; 201.24 kbit/s is the selected mode's measured received payload.

    Charger-present integrated comparison
    MeasureImmediate fixed-rateSelected gated-feedback
    Mean received payload, after 5 s204.91 kbit/s201.24 kbit/s
    Buffer behaviourQueue saturated84.96% mean fill after 5 s
    Recorded full-FIFO rejections19,7190
    Zero-output counter windows, after 5 s0 / 3275 / 327

    Rejection counts cover three complete captures per mode, including startup. Received-payload and occupancy summaries exclude the first 5 seconds. Counter windows are observations at the polling resolution, not proof of gap-free output at every instant.

    Report plot comparing the distributions of received payload rates for the five tested modes after the first five seconds.

    Useful output, measured at the receiver

    The report pools three repeats per mode and retains zero-output windows. The buffered configurations outperform the tested bypass; the comparison does not isolate FIFO residence from admission and decoder behaviour.

    Report plot showing fixed-rate queue saturation and gated-feedback regulation around the 85 percent buffer-fill target.

    Keep reserve and headroom

    The traces show repeat 2 with startup retained. Gated feedback regulates inventory; immediate feedback underfills, while fixed-rate modes approach full occupancy.

    Buffer sizing and evidence limits

    The 2.5 s target uses a 300 kbit/s drain assumption: 37.5 kB/s needs 93.75 kB for 2.5 seconds, within the 110 kB allowance. The implemented 105,472-byte FIFO holds about 2.11 seconds at 75% fill and 2.39 seconds at 85% fill on that assumed basis. Framing and actual transmission timing affect the running drain.

    The target comes from retrospective sizing over the 31 arrival records under ideal recovery. It is not independently validated outage coverage or an application-specific delay guarantee. Packet-arrival gaps are not one-way latency. No mine deployment, recorded-speech playback quality, mine-wide coverage or installation savings was demonstrated.

    Potential future use is non-critical maintenance or status delivery to a fixed optical receiving point, with site-specific cable, electrical, optical and equipment assessment still required.

    Download the reported comparison and context · Versioned data and methods

    Earlier demonstrations / 12 October 2026

    RECORDED TESTS / 12 OCTOBER 2026

    Earlier optical and FIFO demonstrations

    Two views from the actual test and dashboard files. Tap the plots to inspect them.

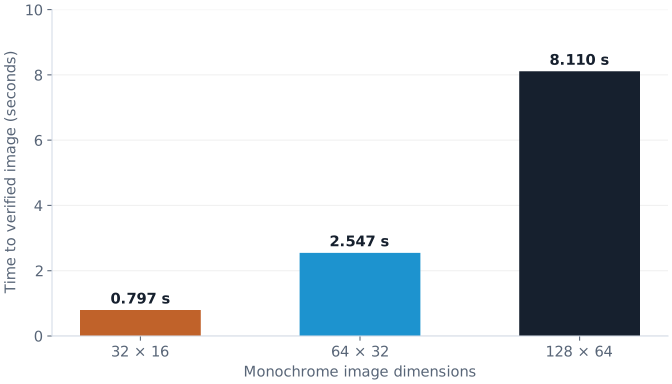
    Measured time to verified monochrome image: 32 by 16 pixels 0.797 seconds, 64 by 32 2.547 seconds, 128 by 64 8.110 seconds

    Bigger pictures take longer

    All three source/received pixel comparisons matched on the local USB → light route. Time includes host pacing and receiver feedback.

    Download plotted image results
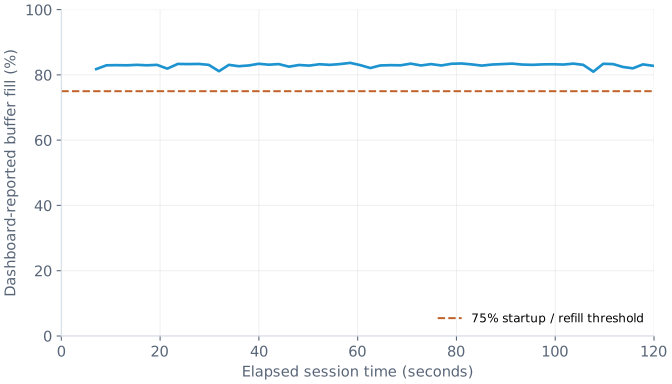
    Recorded gateway dashboard occupancy over the first 120 seconds, with the 75 percent startup and refill threshold marked

    The queue makes the handoff visible

    Buffer occupancy from a PLC-labelled gateway dashboard session. The dashed line marks the configured 75% startup/refill threshold.

    Download plotted FIFO samples
    Test context and limits

    Image source: text_image_vlc_demo/tests/highres_live_acceptance.json. FIFO source: vlc_150khz_test/dashboard/results/20261012_174423_6c2ab0/metrics.csv, first 120 seconds with reported occupancy. Repeated values may be dashboard snapshots. This is not a controlled outage sweep or proof of a particular throttle policy.

    A separate USB-injected FIFO test at 250,000 bit/s queued 85,800 bytes and drained in 3.485 s. The observed receiver sequence span contained 1,525 valid packets and no internal sequence gaps; initial calibration packets were excluded. This was not physical PLC ingress or website-to-rig validation.

    The buffer feedback protocol reports used/free space periodically and supports sender pacing. The later PLC survey and integrated comparison above supersede these extracts for buffer-design evidence. Filtering is a performance option, not a guarantee. These are historical bench results, not live telemetry.

    04 / MAKE IT YOURS

    Words. Pixels. A sketch.
    Start with a message.

    Prepare something on your phone, preview what the receiver will see, and explore the transmission journey.

    Open the message studio

    THE PEOPLE BEHIND THE LINK

    A final-year engineering project.

    School of Electrical and Information Engineering
    University of the Witwatersrand

    ELEN4012A

    SUPERVISOR

    Prof Ling Cheng

    POWERLINE COMMUNICATION

    Nduvho Edward Ramashia

    VISIBLE LIGHT COMMUNICATION

    Israel Chiloane

    PLC characterisation: Nduvho E. Ramashia. VLC development: Israel Chiloane. Buffer requirements, integration and integrated analysis were shared. Supervised by Prof. Ling Cheng.

    View the project on GitHub ↗